
Account Overview

We have just released a new "Overview" tab to our wallet pages, which contains some analytics and widgets on the specific wallet.
To view this page, you can use the search box at the top of our app to find any wallet by its address or ENS name.
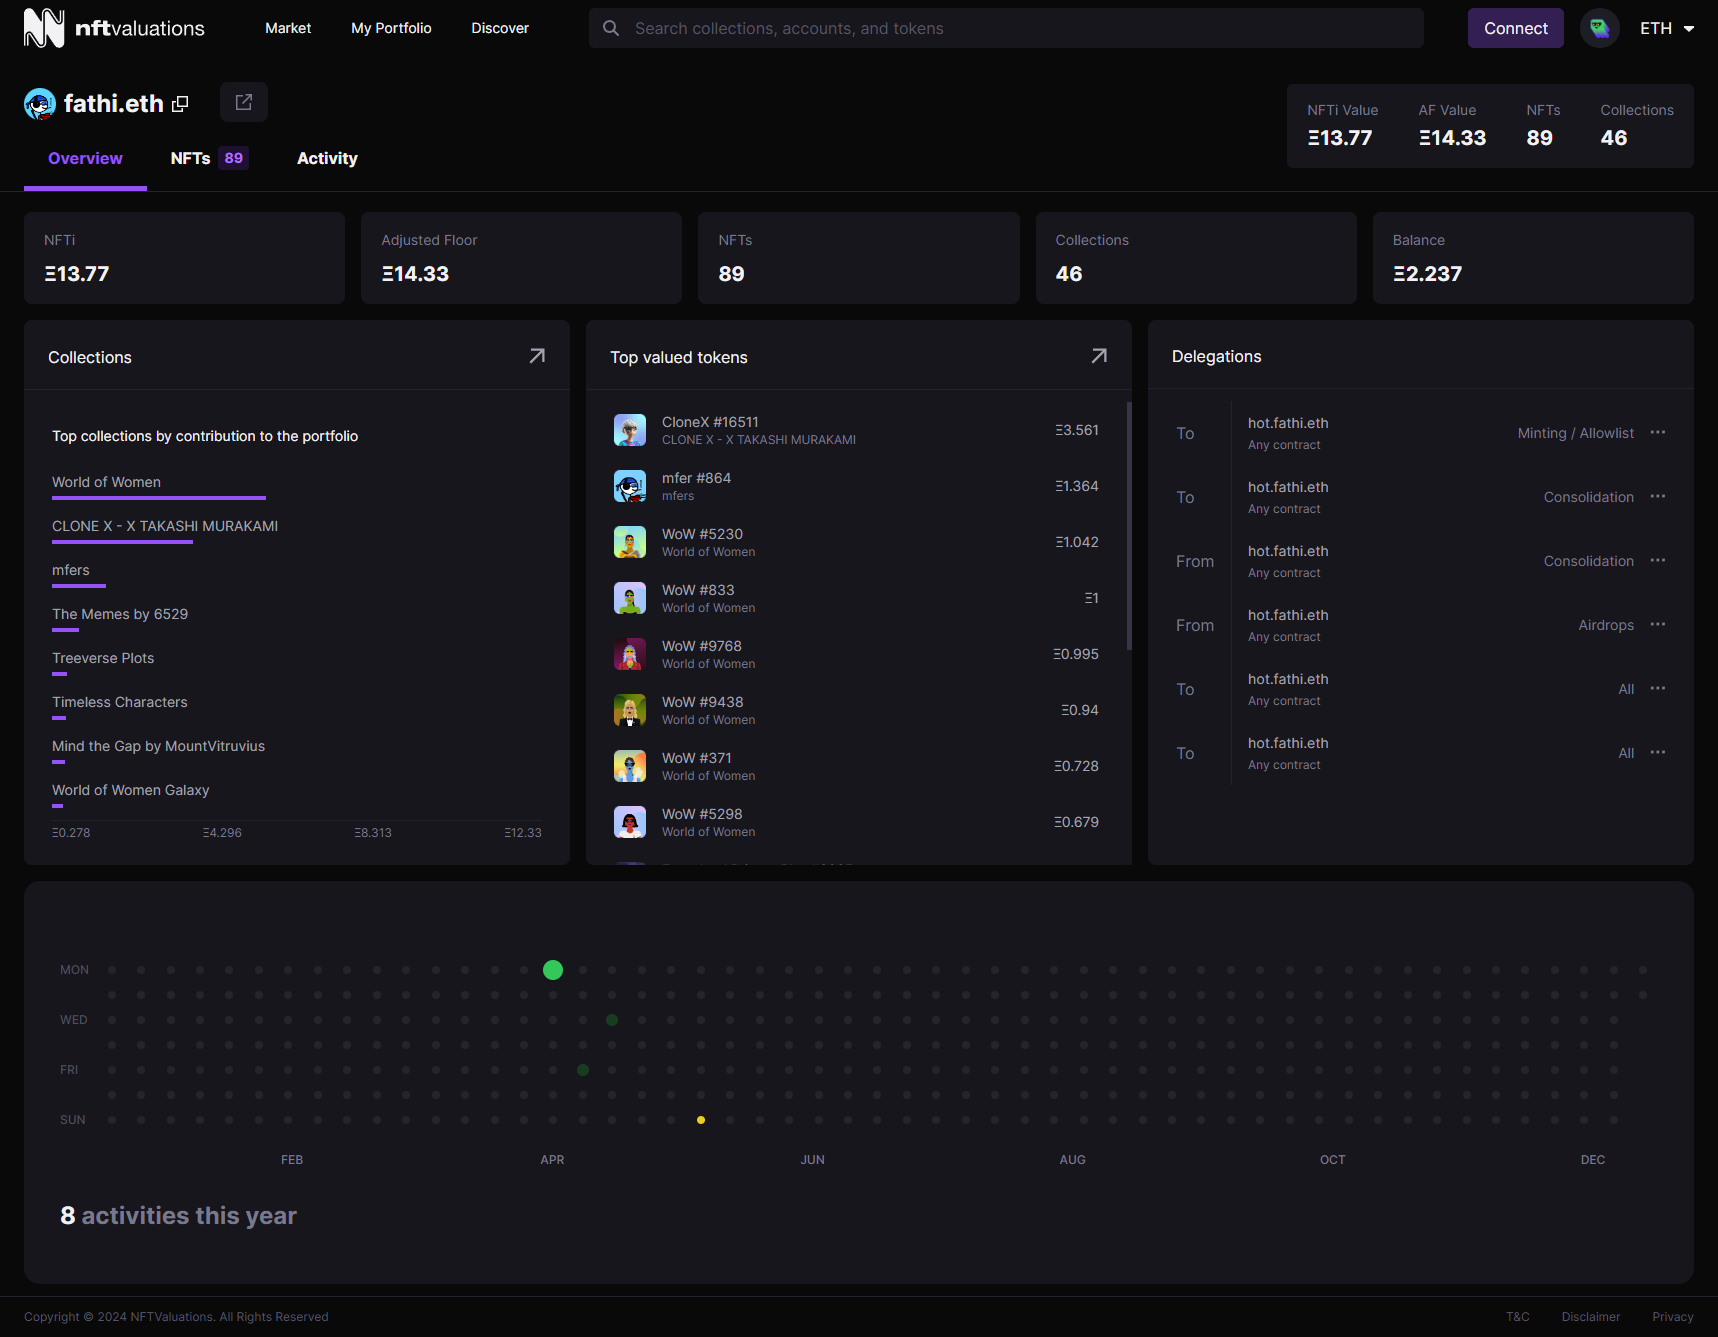
The top row of the page is dedicated to very important stats about the wallet:
NFTi: The total value of all the NFTs in the wallet. NFTi is our machine-learning-powered valuation model, valuing each NFT using a wide array of market and rarity data. You can read more about NFTi in our dedicated blog post.
Adjusted Floor: The total value of all the NFTs in the wallet using the Adjusted Floor (AF) valuation method. AF is our straightforward trait-floor valuation model. You can read more about AF in our dedicated blog post.
NFTs: The total number of NFTs in the wallet.
Collections: The total number of unique collections that the wallet is a holder of.
Balance: The ETH & WETH balance of the wallet.
Below the stats row, we have a series of widgets that we find helpful to provide a quick glance into any wallet.
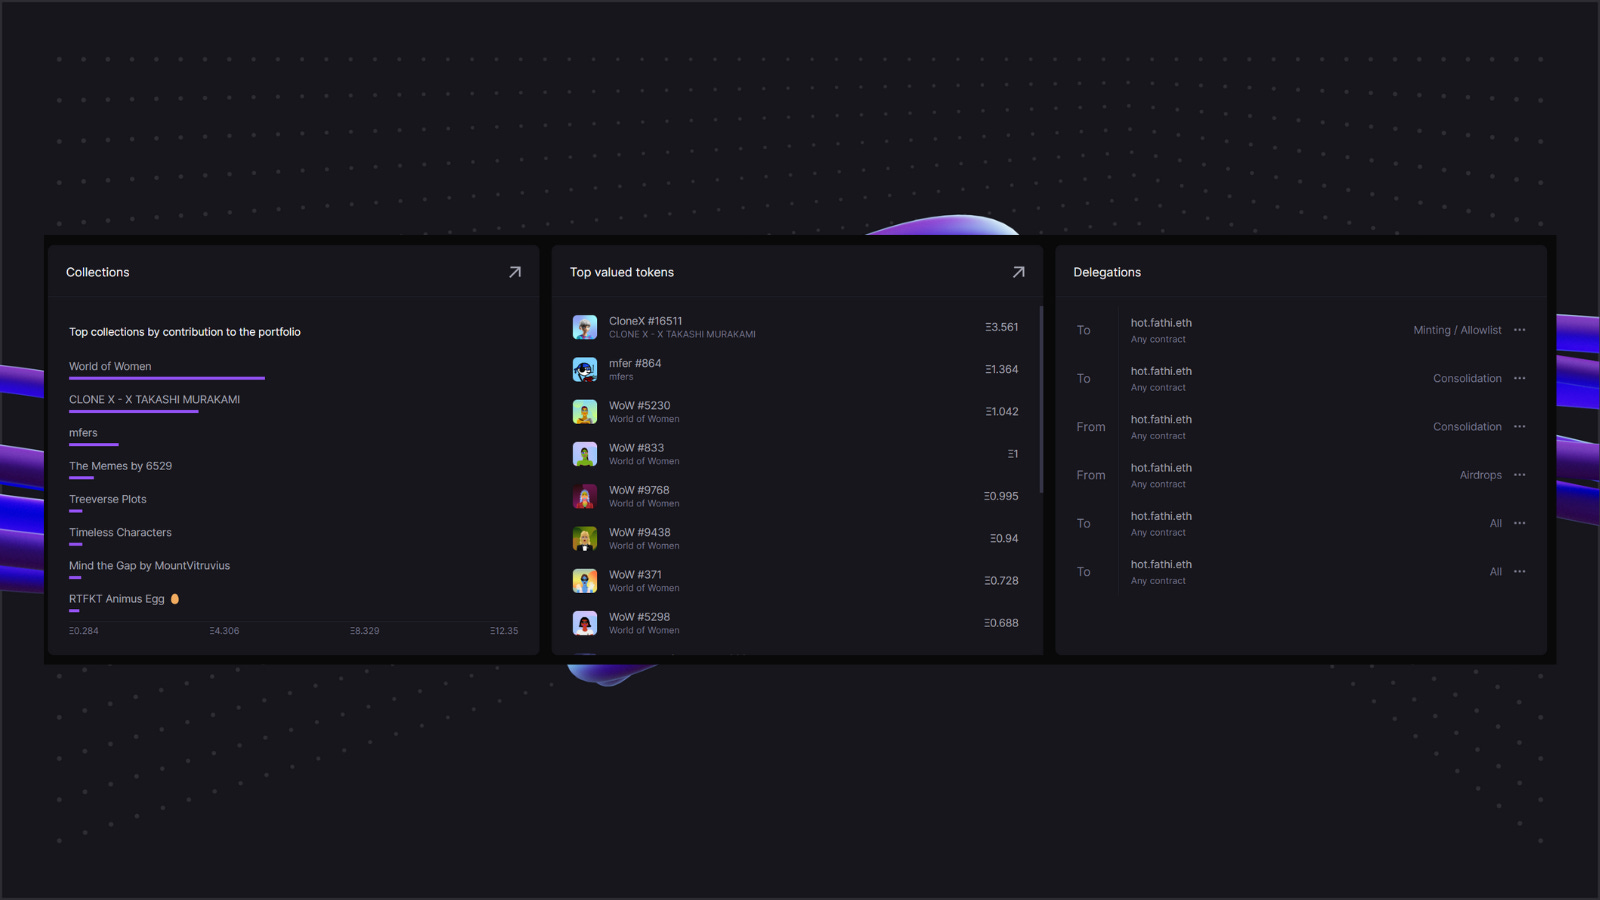
Collections
This widget shows the wallet's value distribution. The collections that contribute the most value to the wallet are shown on a bar chart, along with their contribution % and the collection's total value.
The value of each collection is calculated by taking the sum of every token's NFTi valuation from the given collection.
Top Valued Tokens
This widget lists the NFTs with the highest valuation from the wallet. The "NFTs" tab of the wallet page provides a complete list and additional details.
Delegations
This widget shows all the delegations that the given wallet is involved in. Delegations are a great way to keep your assets safe.
The best solution to secure valuable onchain assets while still participating in NFT airdrop claims, ERC20 token governance, and more. Users link cold wallets with hot wallets, and then the hot wallet can act on behalf of the cold wallet, like crypto power-of-attorney.
- Delegate.xyz
We currently support the following delegation protocols:
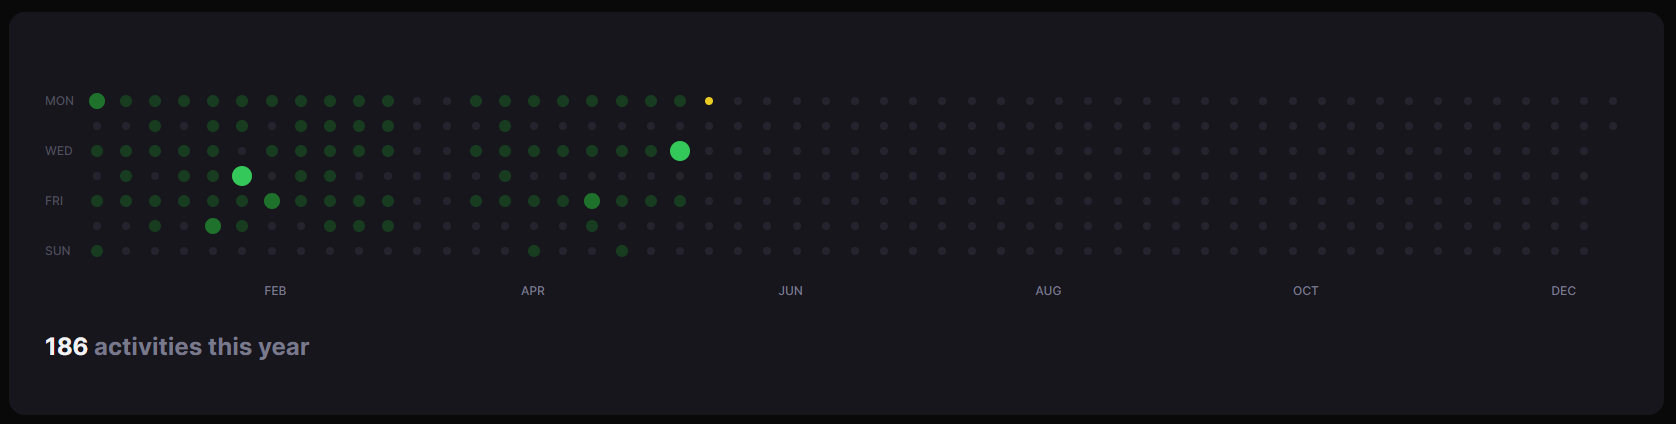
Activity Map
The activity map shows the current year from beginning to end; each column represents one week, and each dot represents a single day.
This widget shows how active a wallet is on each day of the year. The dot gets larger for days with a higher-than-average number of activities. The yellow dot indicates the current day.
Activities that reflect on this chart are any actions the specific wallet performs. Some examples include transferring a token, buying/selling, making a bid, accepting a bid, listing an NFT, and more. An action that is performed by another wallet to the specified wallet will not count towards the activity map (e.g. another wallet making a bid on an NFT that belongs to the given wallet)
Conclusion
As this is a new release, we expect some issues to arise as more people use it and give us feedback. We are going to be watching our Twitter and Discord so that we can address any problems immediately. If you have not already, follow us on Twitter and join our Discord! We'd love to hear your feedback about this release and NFT Valuations. 💜